Running a restaurant means managing dozens of moving pieces every single day. Your team shows up (or doesn't), shifts get covered (or they don't), and somewhere between the morning rush and closing cleanup, you're trying to figure out who's thriving and who's quietly checking out.
What if you could see it all clearly, before problems become crises?
The Morning Report That Changes Everything
It's 7 AM. Before you've even walked through the door, your daily report shows exactly what happened yesterday across your location.
Benjamin was 13 minutes late for his shift. Charlotte clocked in but never clocked out. You see it all in one glance: color-coded by severity, organized by exception type.
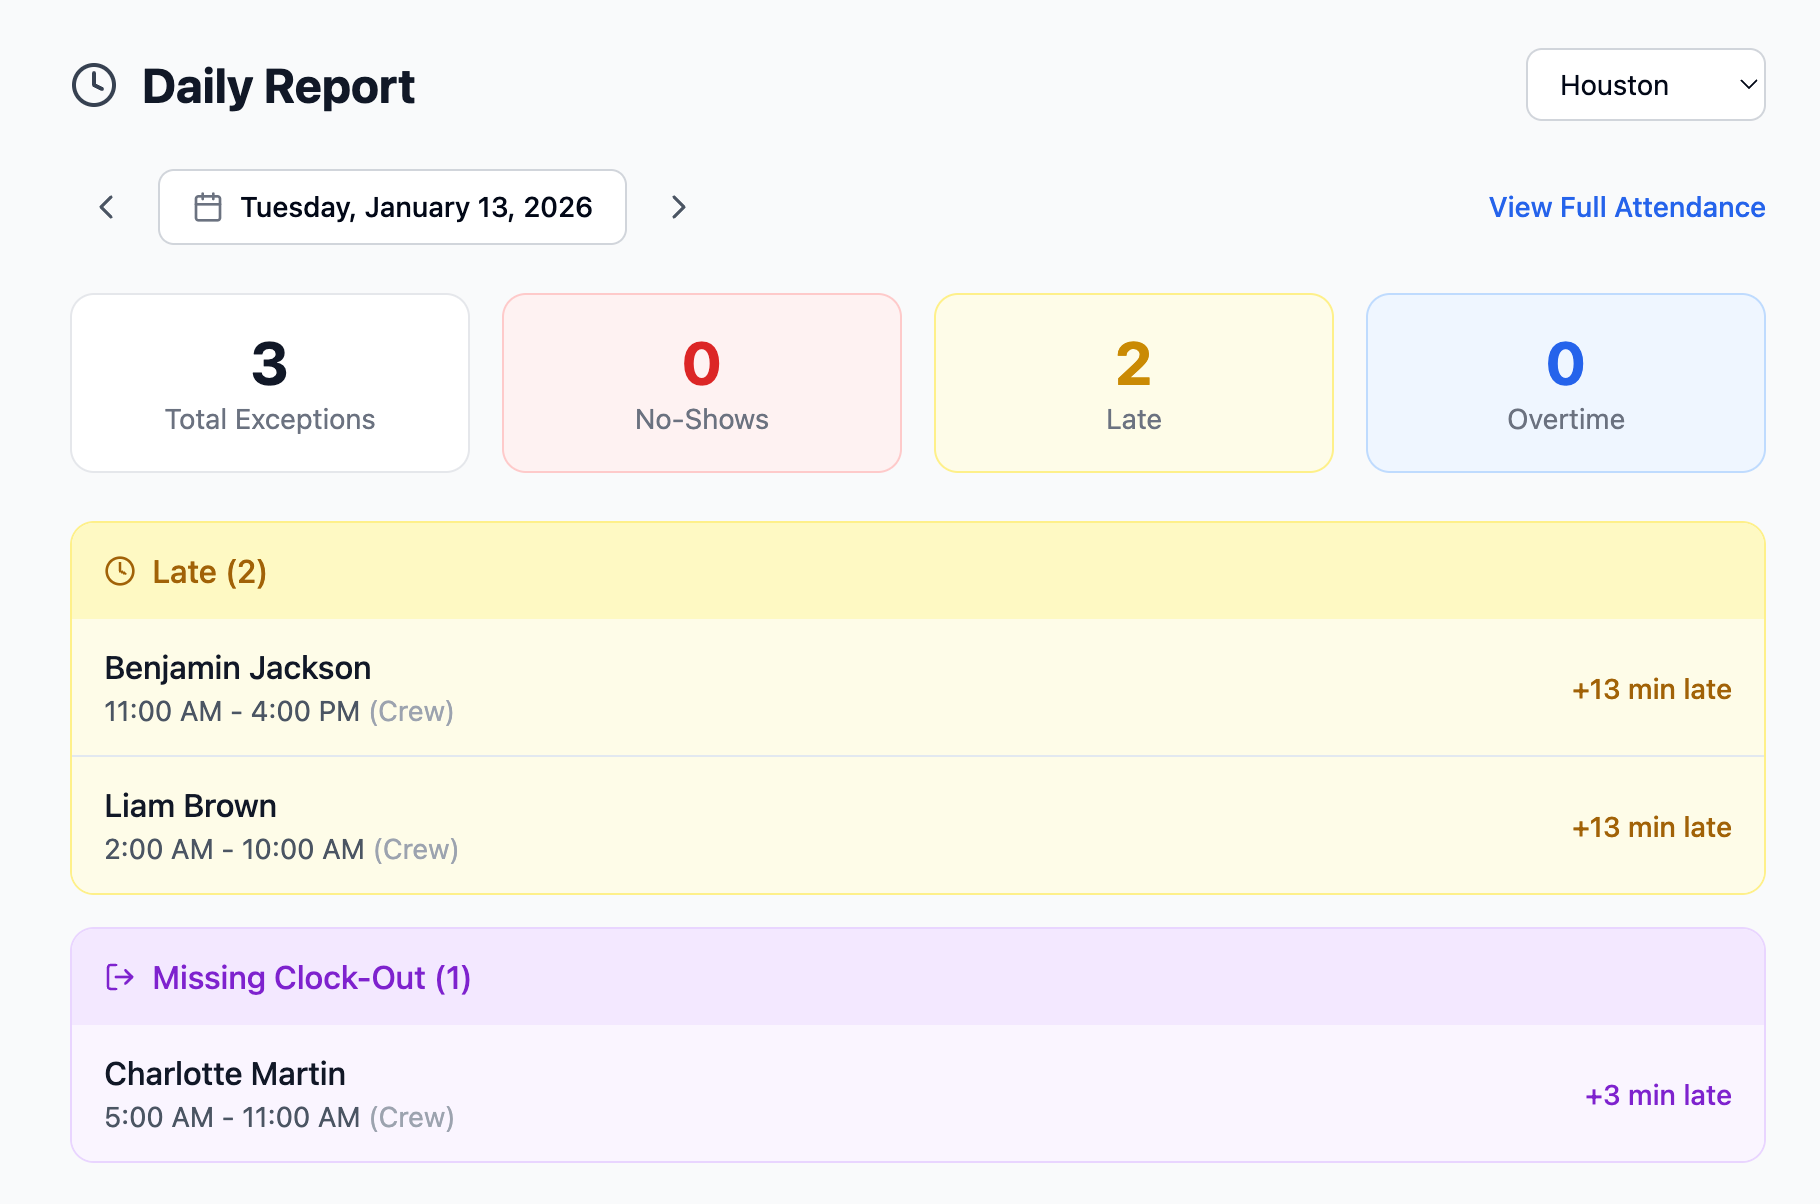
No more hunting through timesheets. No more asking shift leads what happened. Just clear, actionable information waiting for you with your first cup of coffee.
Beyond Attendance: Understanding Engagement
Tracking who showed up is table stakes. The real question is: who's actually engaged?
Traditional attendance systems tell you someone was late. PeakOps tells you they've been late three times this week, their shift feedback has been declining for two weeks, and they dropped two shifts last month.
That's not just a lateness problem. That's an employee who's checking out.
Our engagement scoring combines multiple signals:
- Punctuality patterns: Not just today, but trending over time
- Shift feedback: How employees rate their own shifts tells you volumes
- Behavioral signals: Shift bids show enthusiasm; shift drops show disengagement
- No-show history: The clearest signal that something's wrong
When an employee's engagement score starts declining, you know about it weeks before they hand in their notice, or worse, just stop showing up.
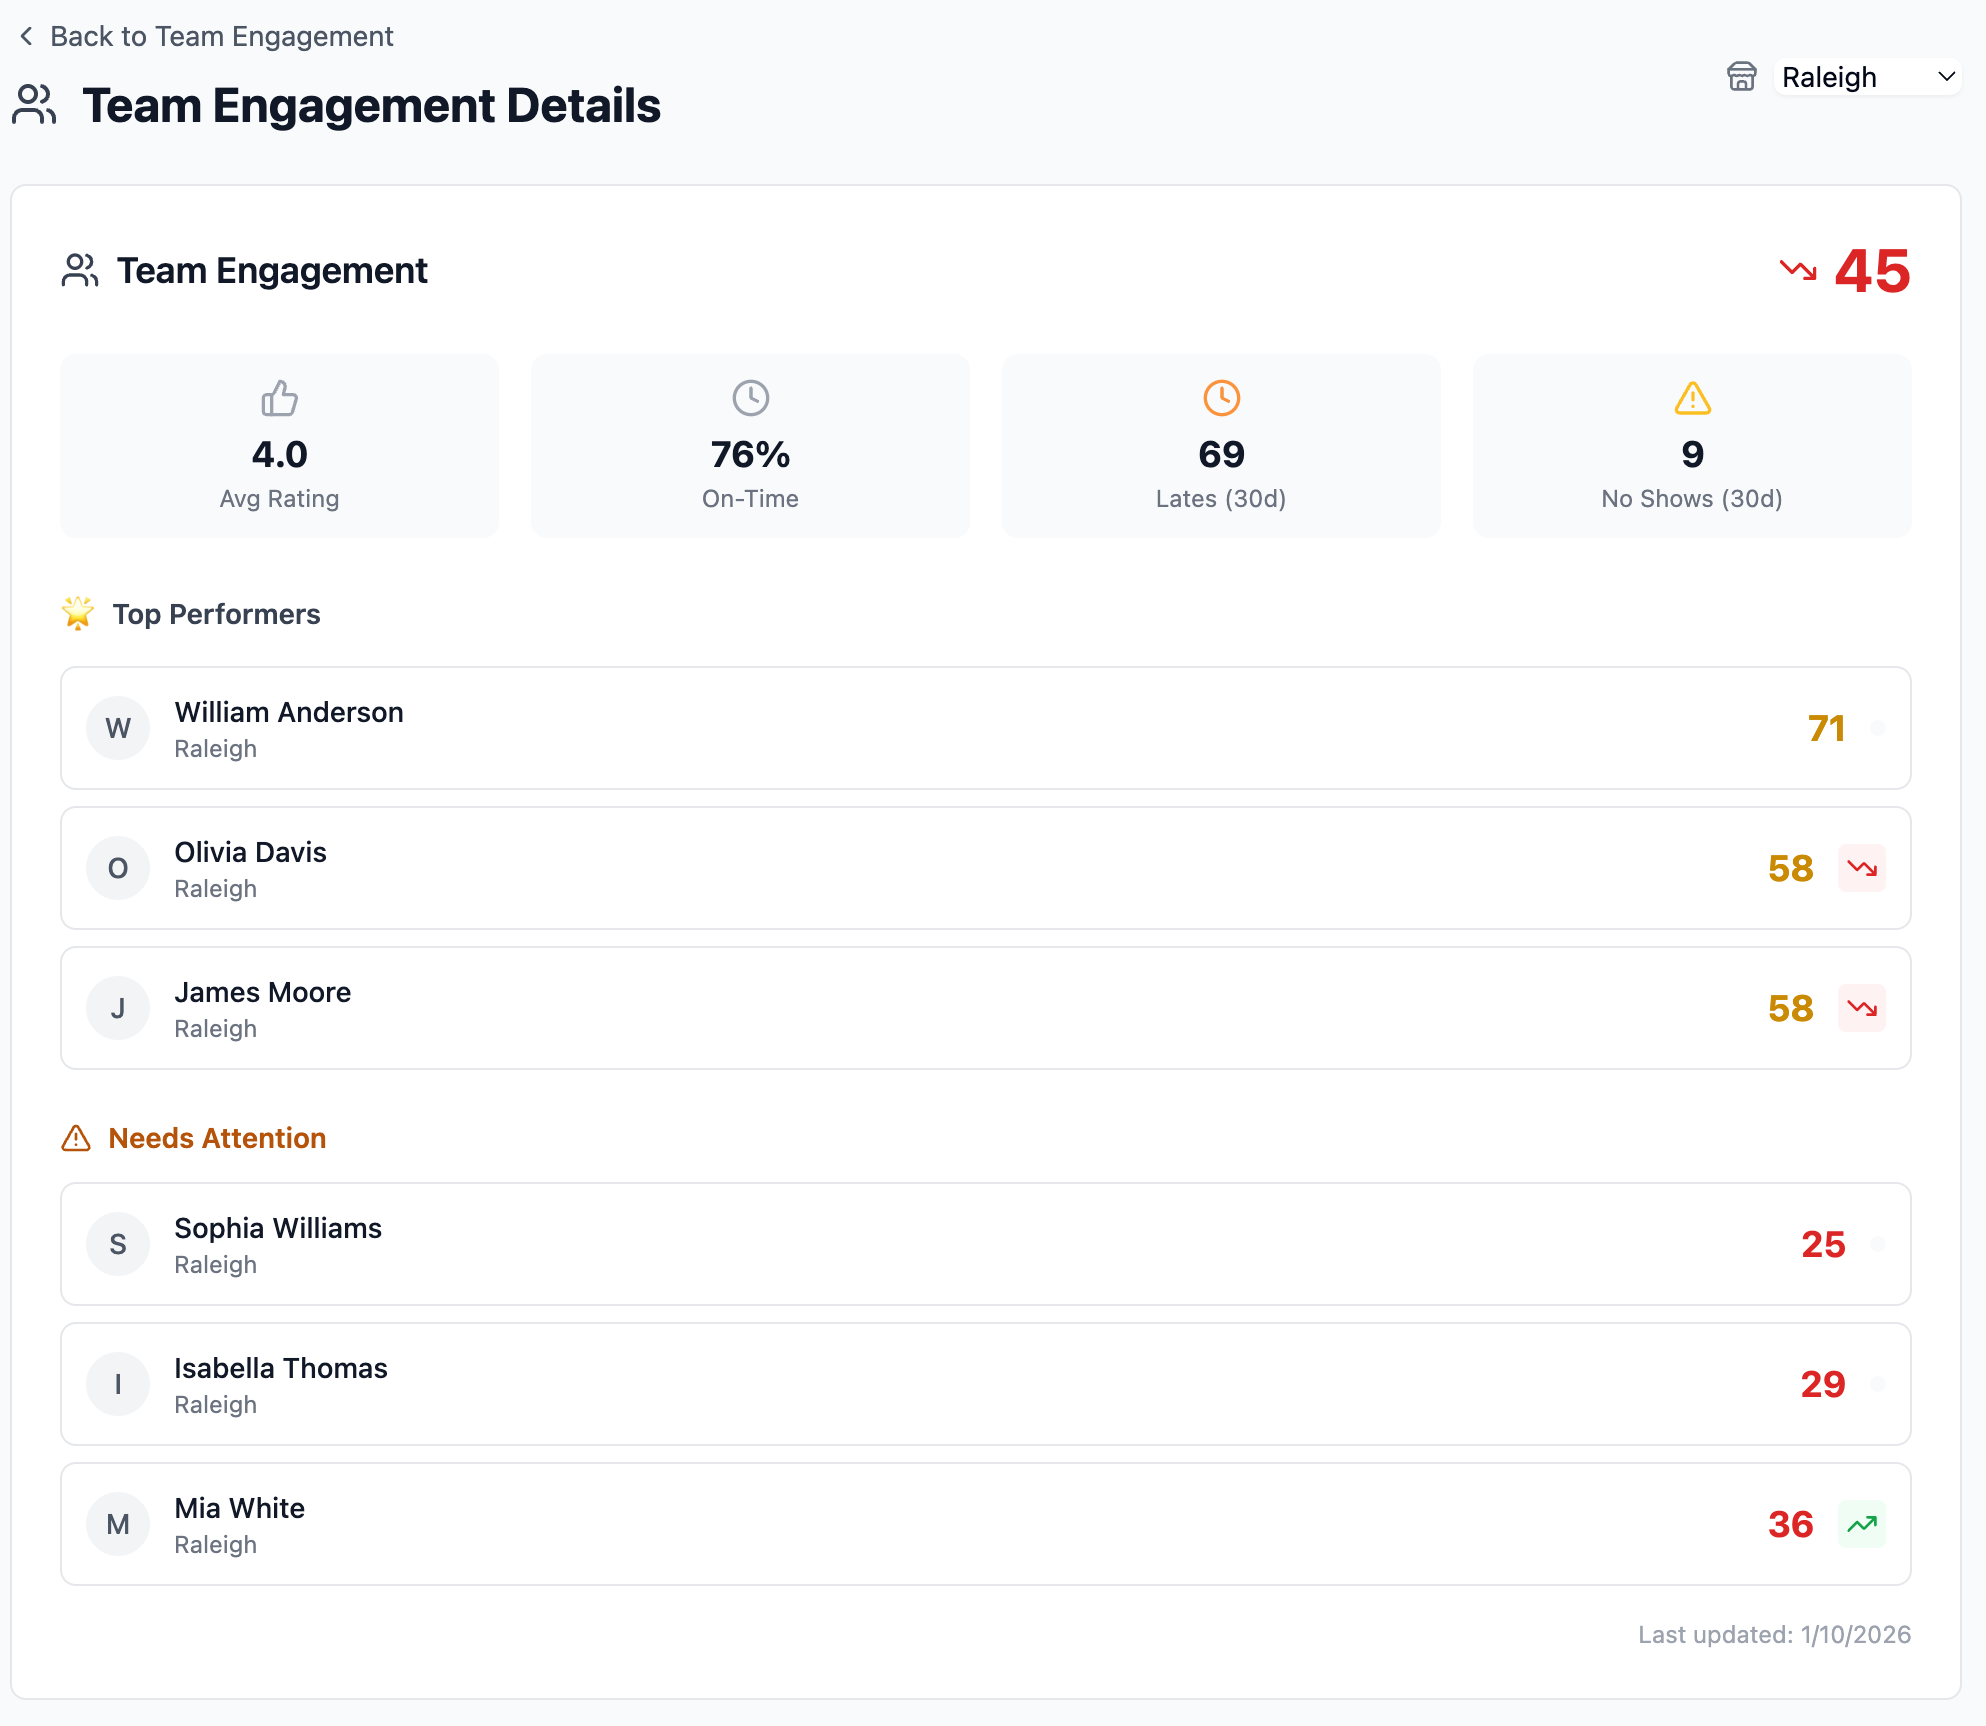
At a glance, you see who's thriving (William at 71) and who needs attention (Sophia at 25). The trend arrows tell you if things are getting better or worse.
Drill Down to Individual Employees
Click any employee and see their complete engagement profile. Mia's score of 36 is below the team average, but the "Improving" badge tells you she's trending in the right direction.
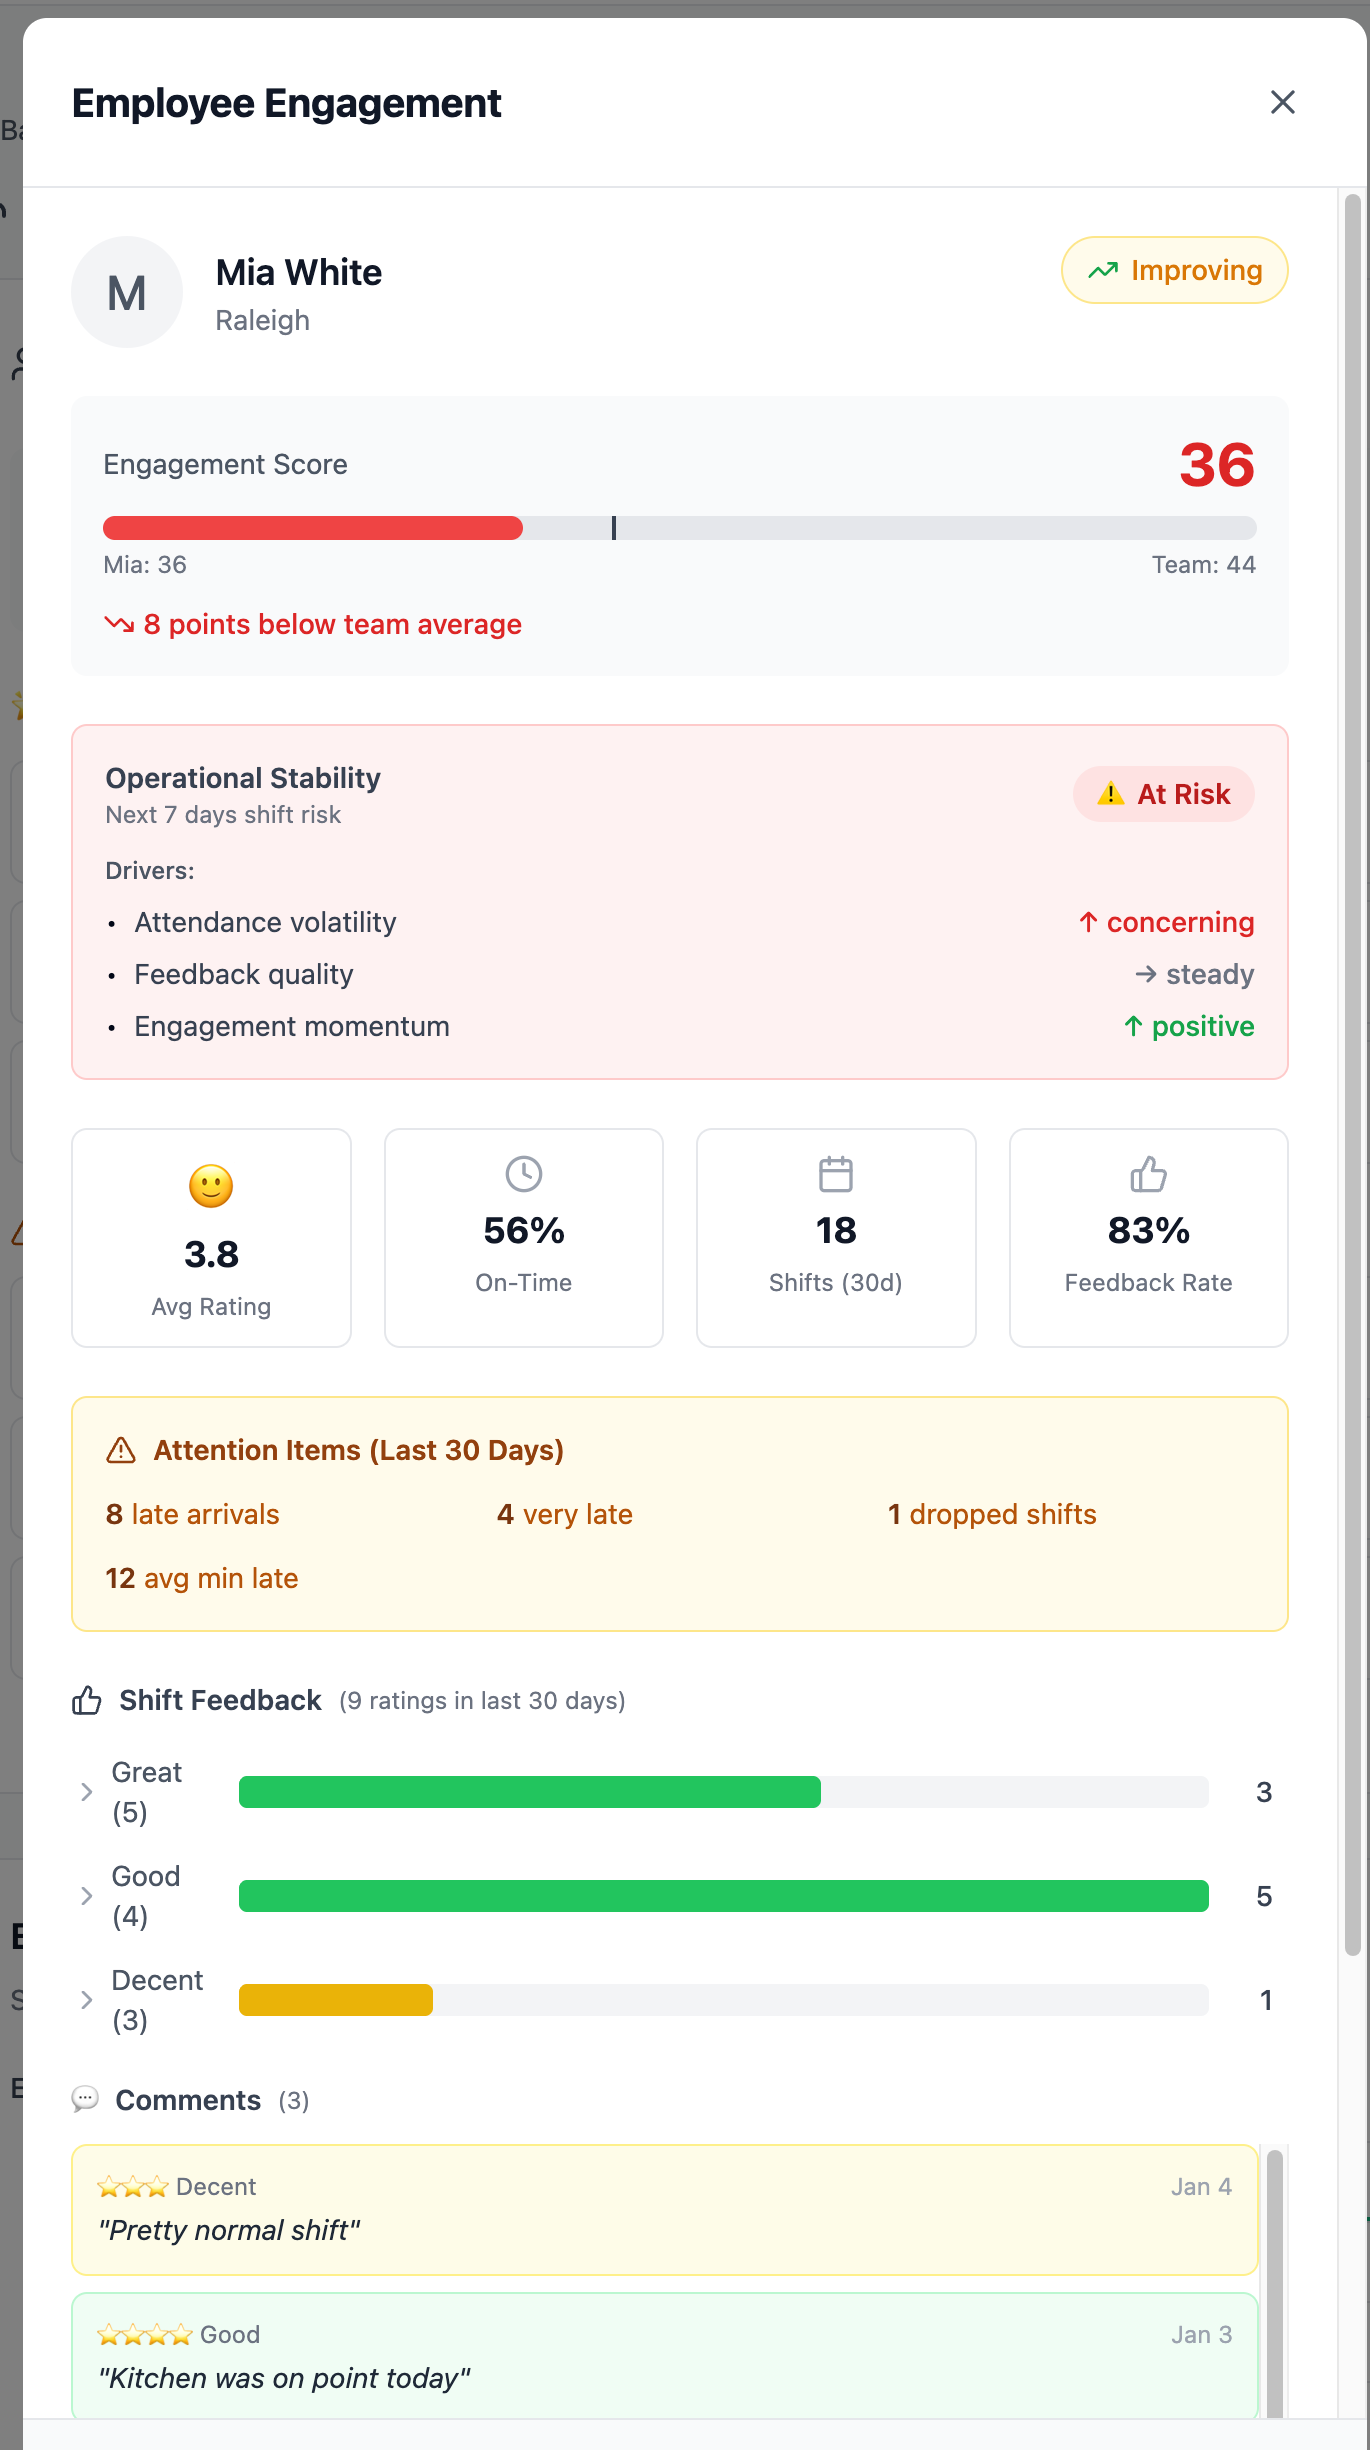
You see everything that matters: 8 late arrivals in the last 30 days, averaging 12 minutes. Her shift feedback breakdown. The specific factors driving her "At Risk" operational stability rating. When it's time for that conversation, you have the data to make it constructive.
The At-Risk Alert That Saves Your Weekend
Picture this: It's Thursday afternoon. You check your Team Engagement dashboard. Three of your weekend closers are flagged as at-risk: engagement declining, recent no-shows, negative shift feedback.
Without this insight, you'd find out Saturday night when two of them don't show.
With it, you have 48 hours to have conversations, adjust the schedule, and ensure coverage.
At-Risk
Multiple warning signs. Intervention needed.
Caution
Some concerning signals. Worth monitoring.
Stable
Consistent performance. On track.
The system doesn't just flag problems; it prioritizes them. The "Today's Action" box tells you exactly who needs attention first and why, with specific recommendations.
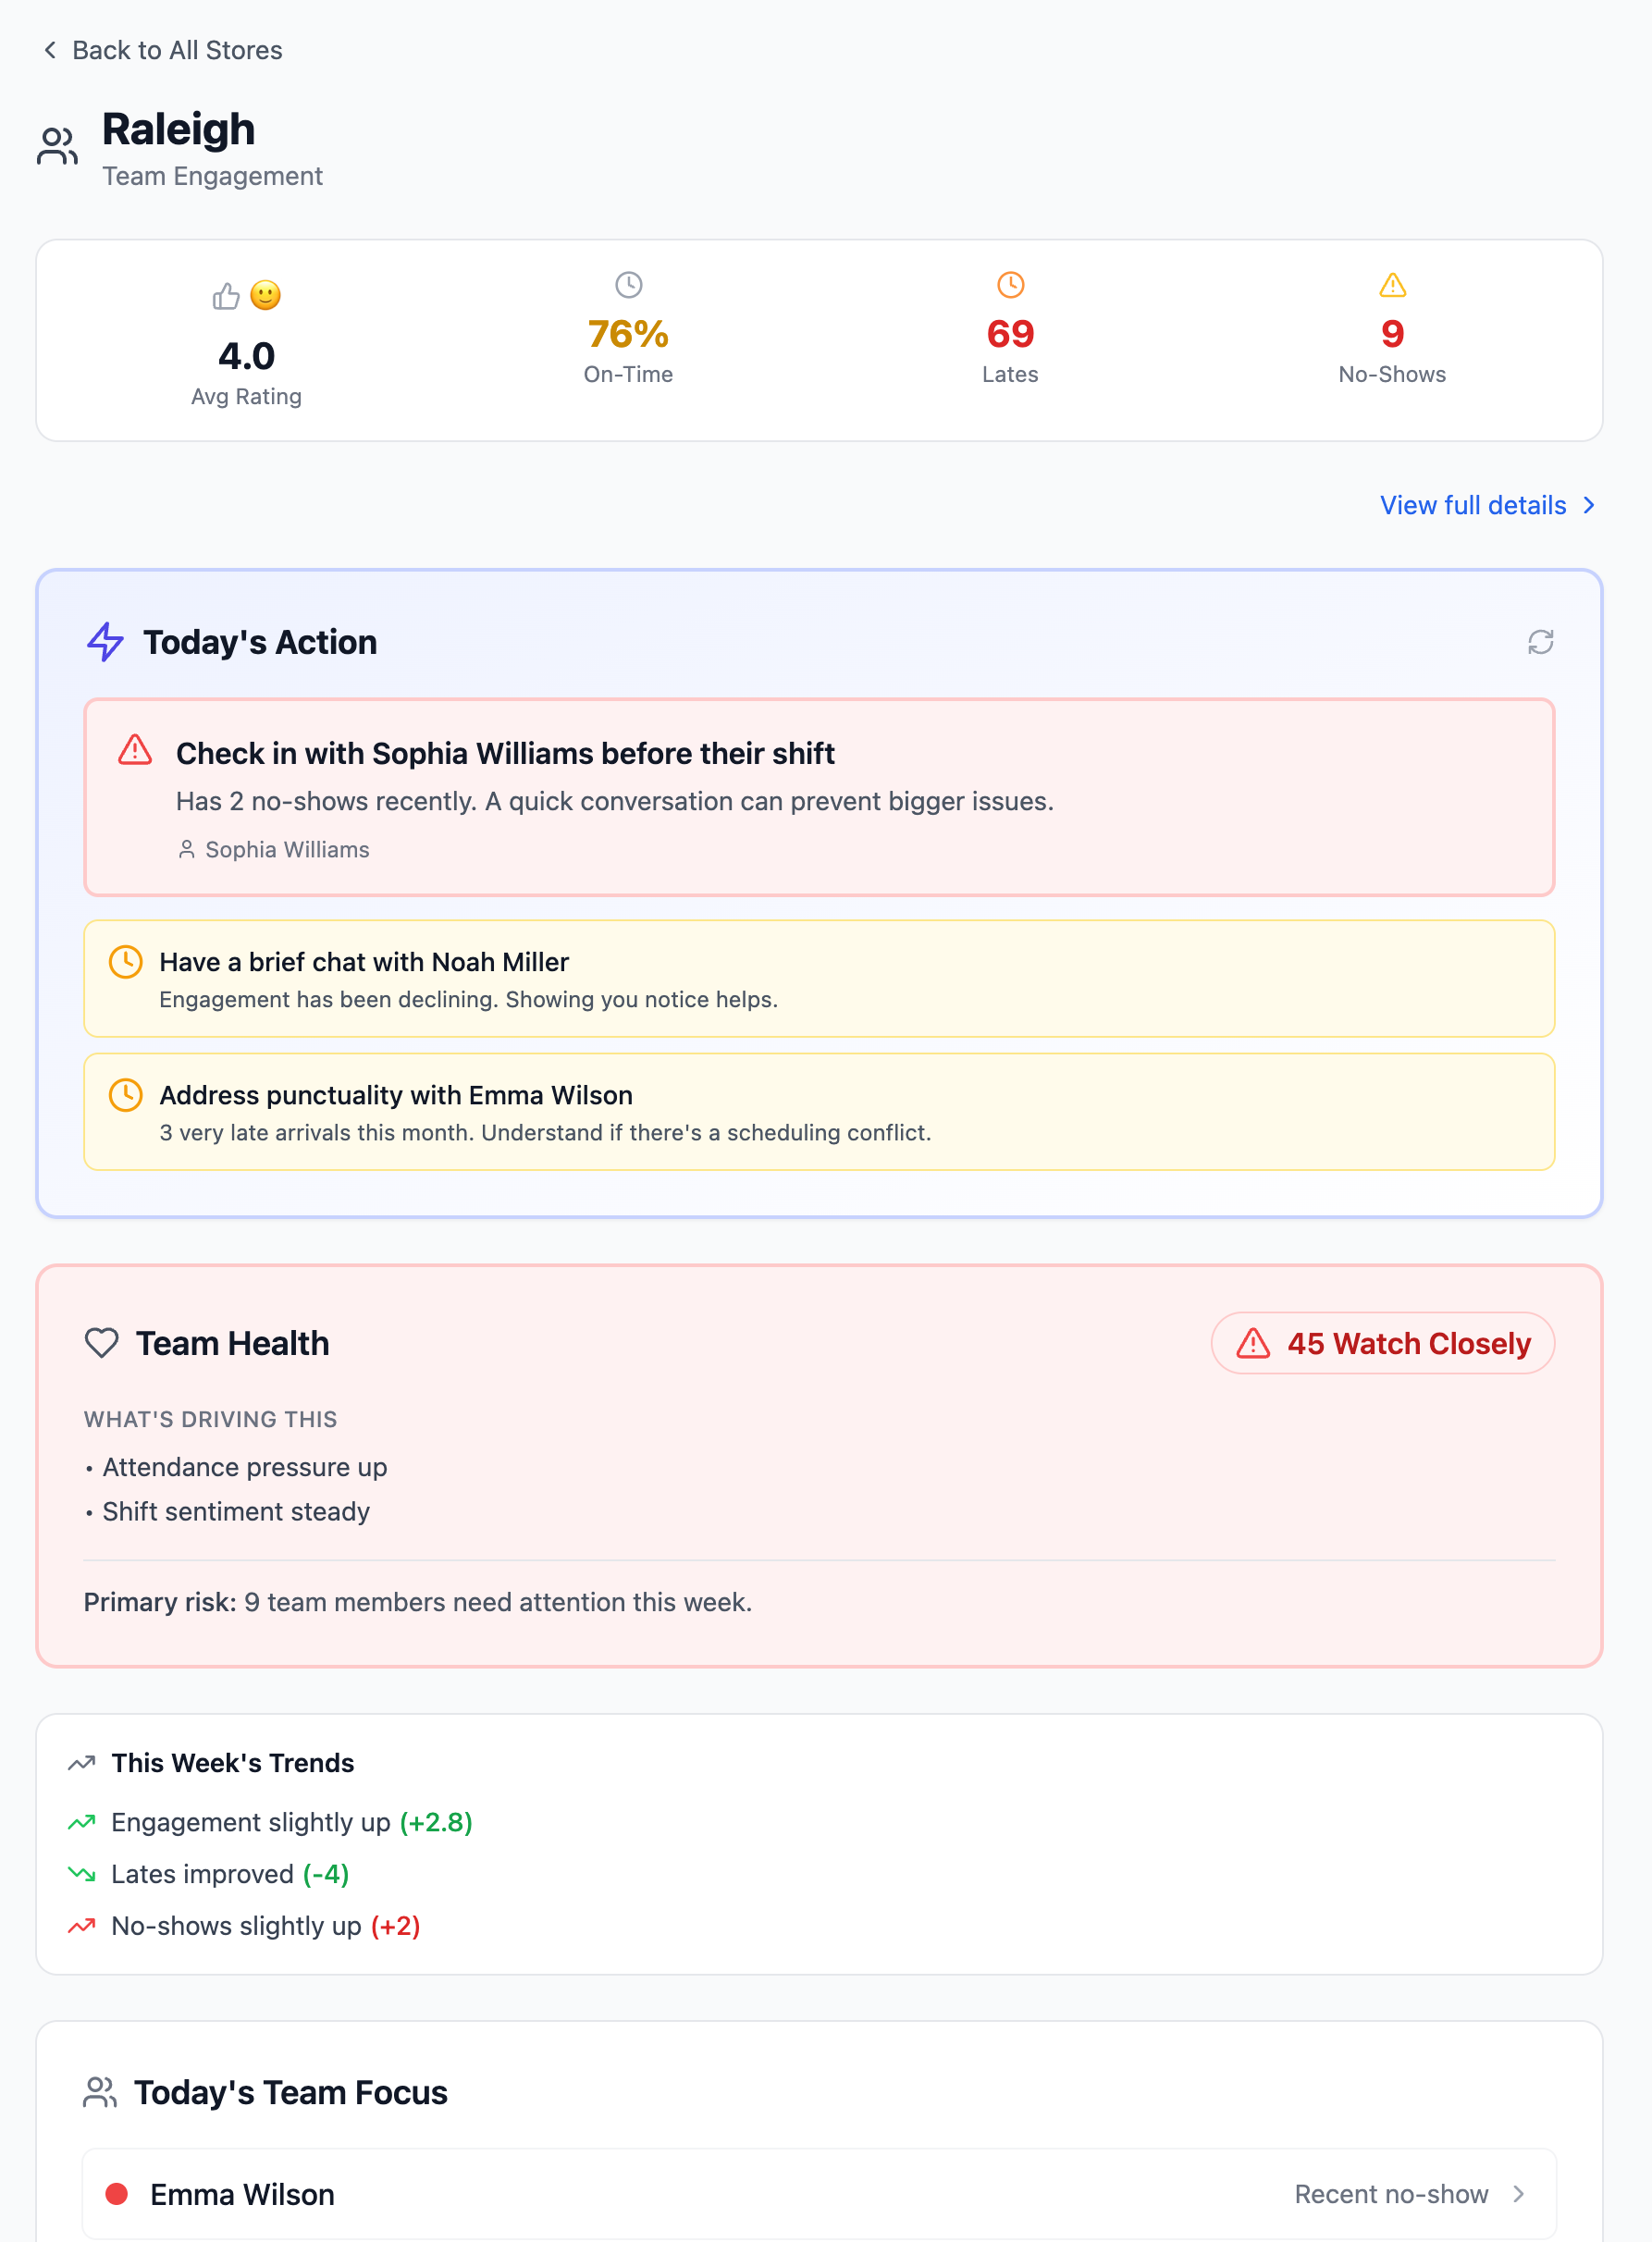
"Check in with Sophia Williams before their shift. Has 2 no-shows recently." "Have a brief chat with Noah Miller. Engagement has been declining." These aren't generic suggestions. They're context-aware recommendations based on what's actually happening.
The Visual Timeline: Operations at a Glance
Some days you need the big picture. The Attendance page shows every employee's shift on a single timeline, from 6 AM to 10 PM, color-coded by status.
Green blocks mean on-time arrivals. Red means no-show. Purple flags a missing clock-out.
You can scan an entire day's operations in seconds and know exactly where the gaps were.
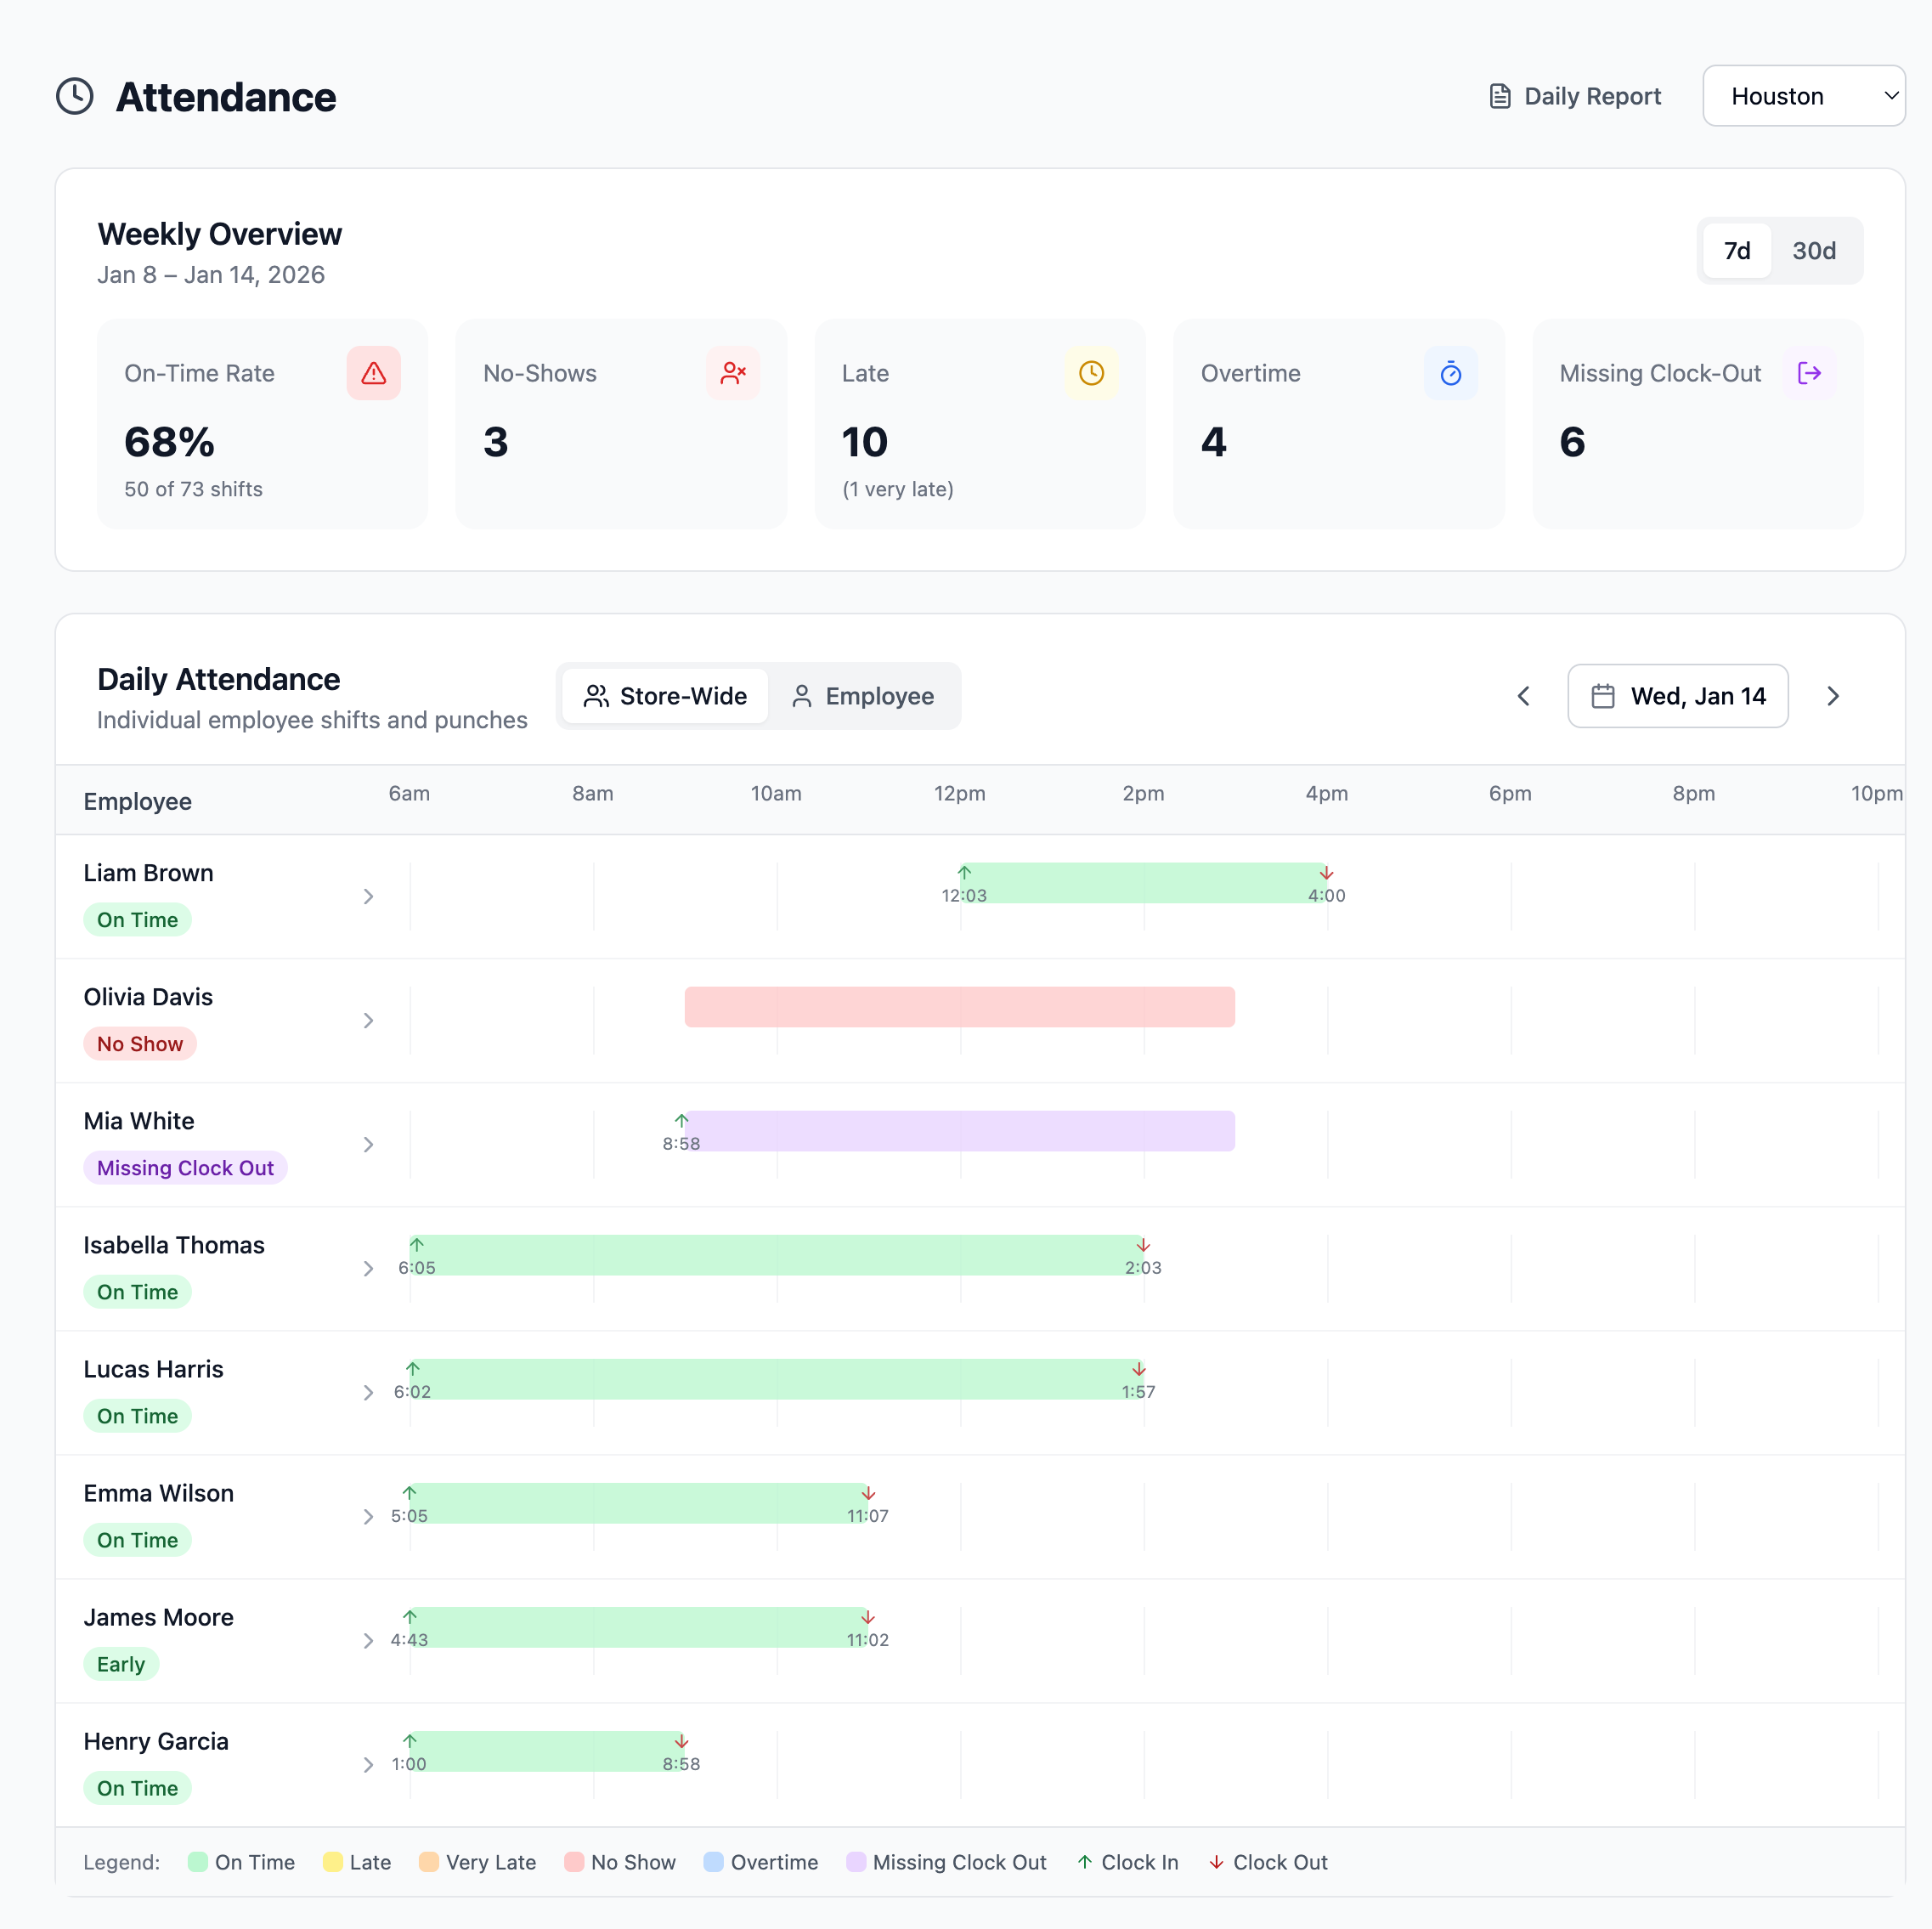
The weekly overview at the top gives you the aggregate: 68% on-time rate, 3 no-shows, 10 late arrivals. Click any employee to drill down to their individual history.
Track Trends Over Time
Point-in-time data is useful. Trends are powerful. The engagement trends chart shows you how your team is doing over weeks, not just today.
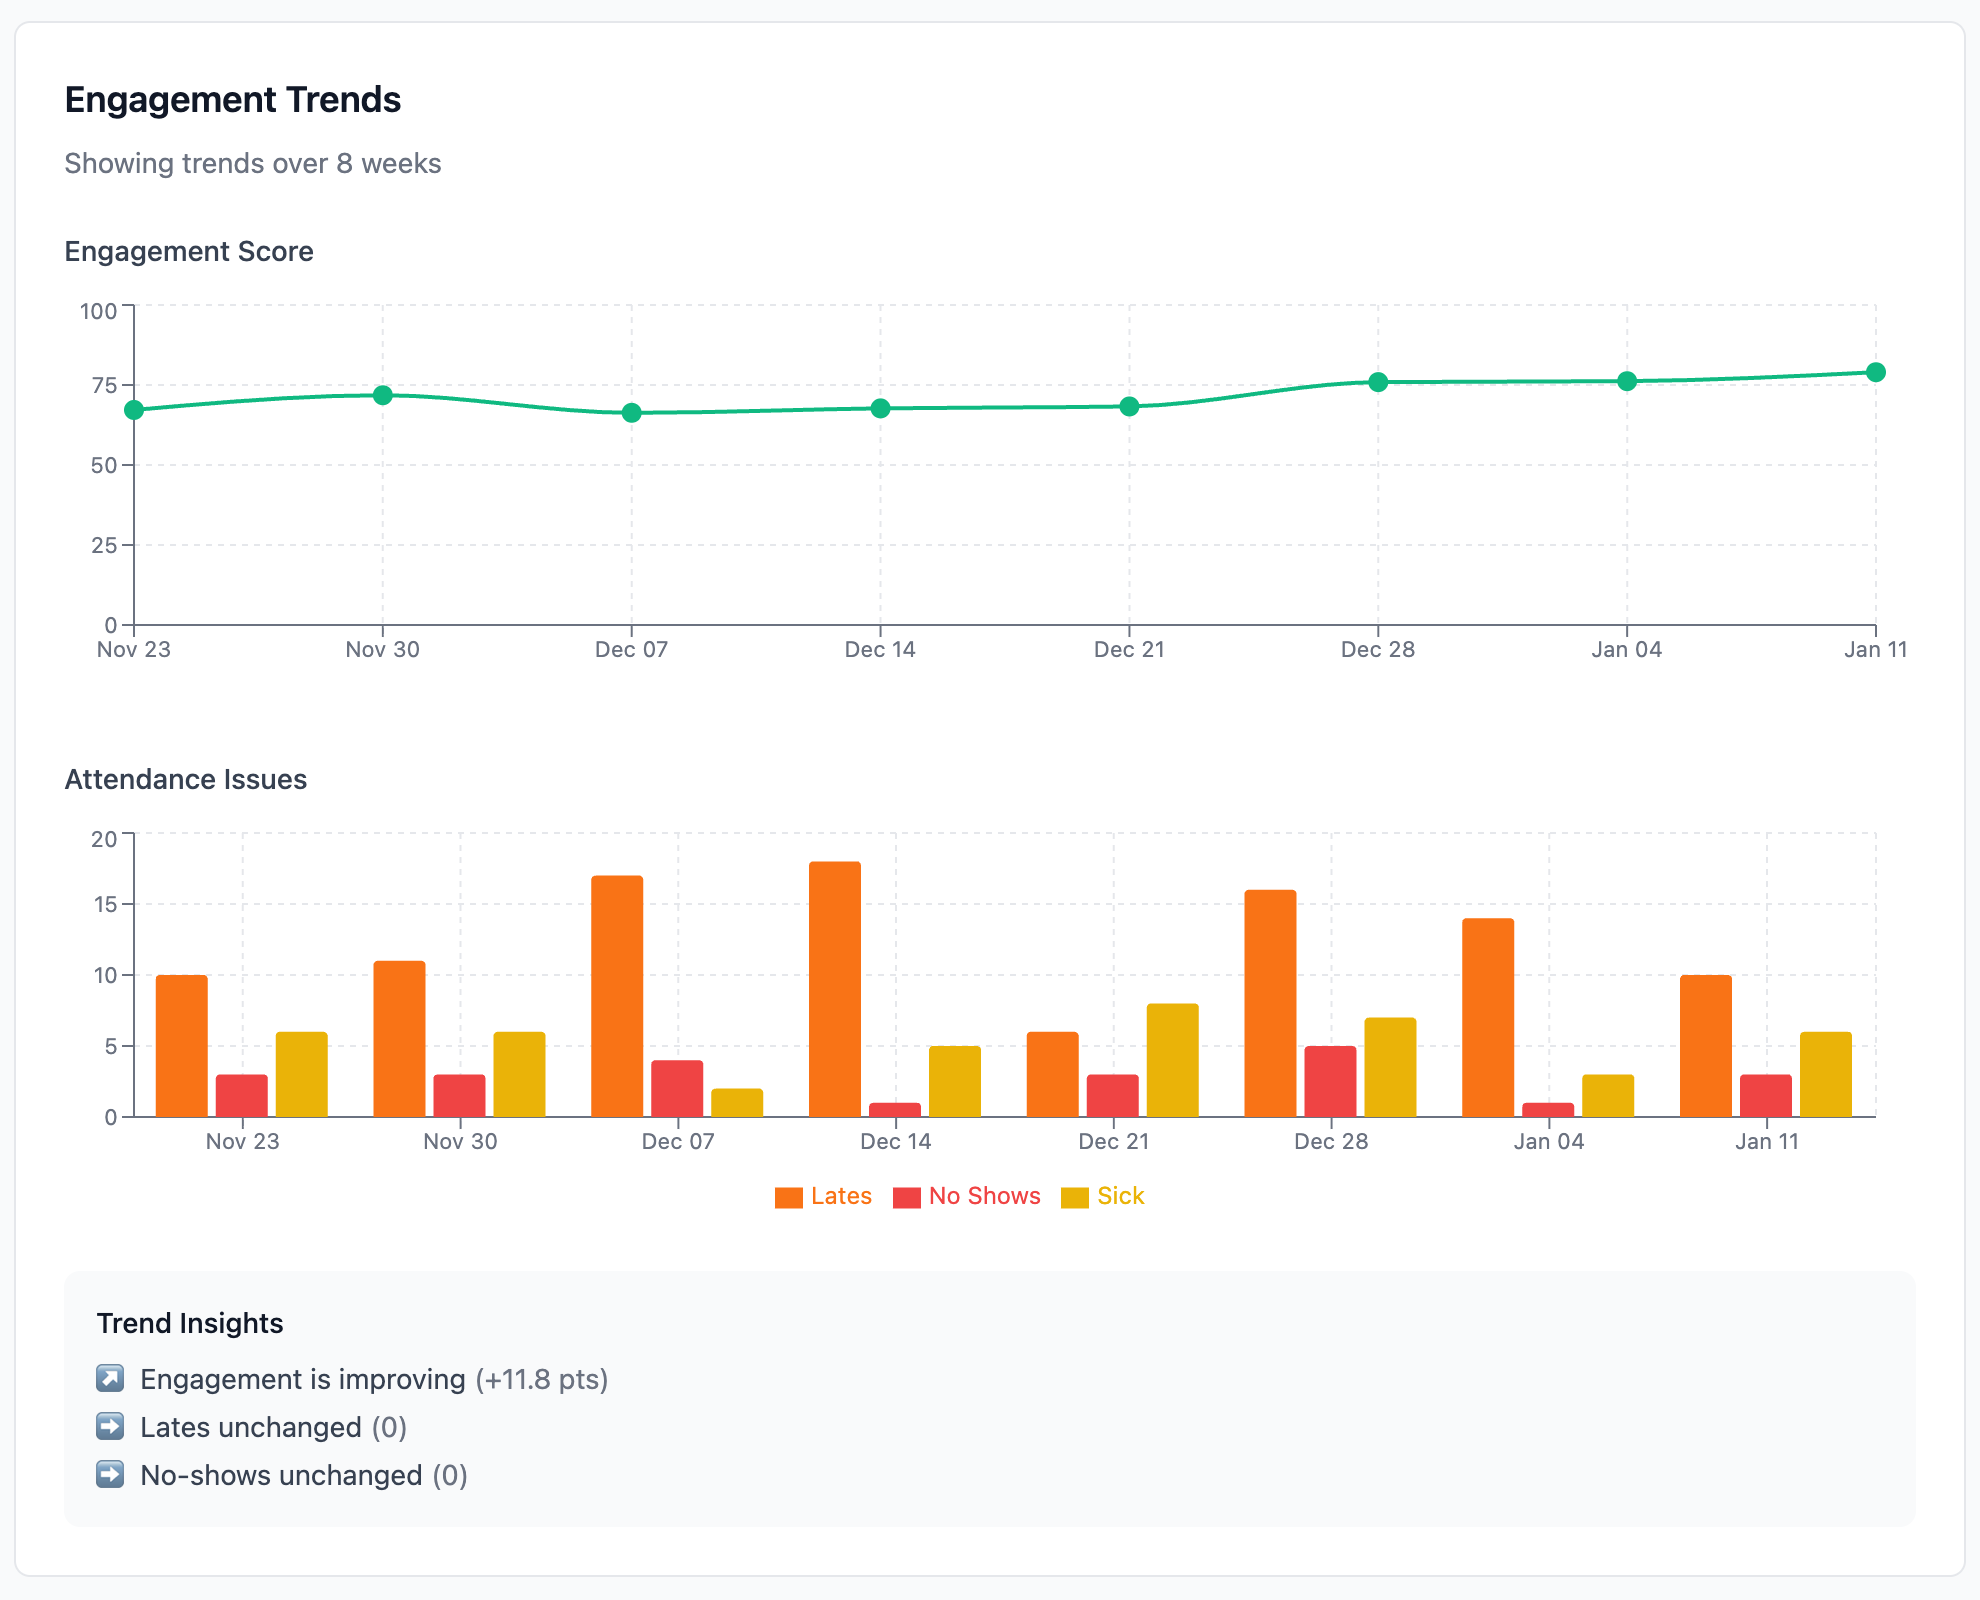
See the engagement score climbing from 67 to 80 over eight weeks. Watch lates and no-shows fluctuate. The "Trend Insights" at the bottom summarize it: "Engagement is improving (+11.8 pts)." That's the kind of signal that tells you your efforts are working.
Hear What Your Team Is Actually Saying
Numbers tell part of the story. Employee feedback tells the rest.
When employees rate their shifts, patterns emerge. The Shift Feedback Intelligence panel analyzes comments automatically, surfacing themes like "Guest Satisfaction," "Team Dynamics," or warning signs like "Staffing Pressure" and "Overwhelm."
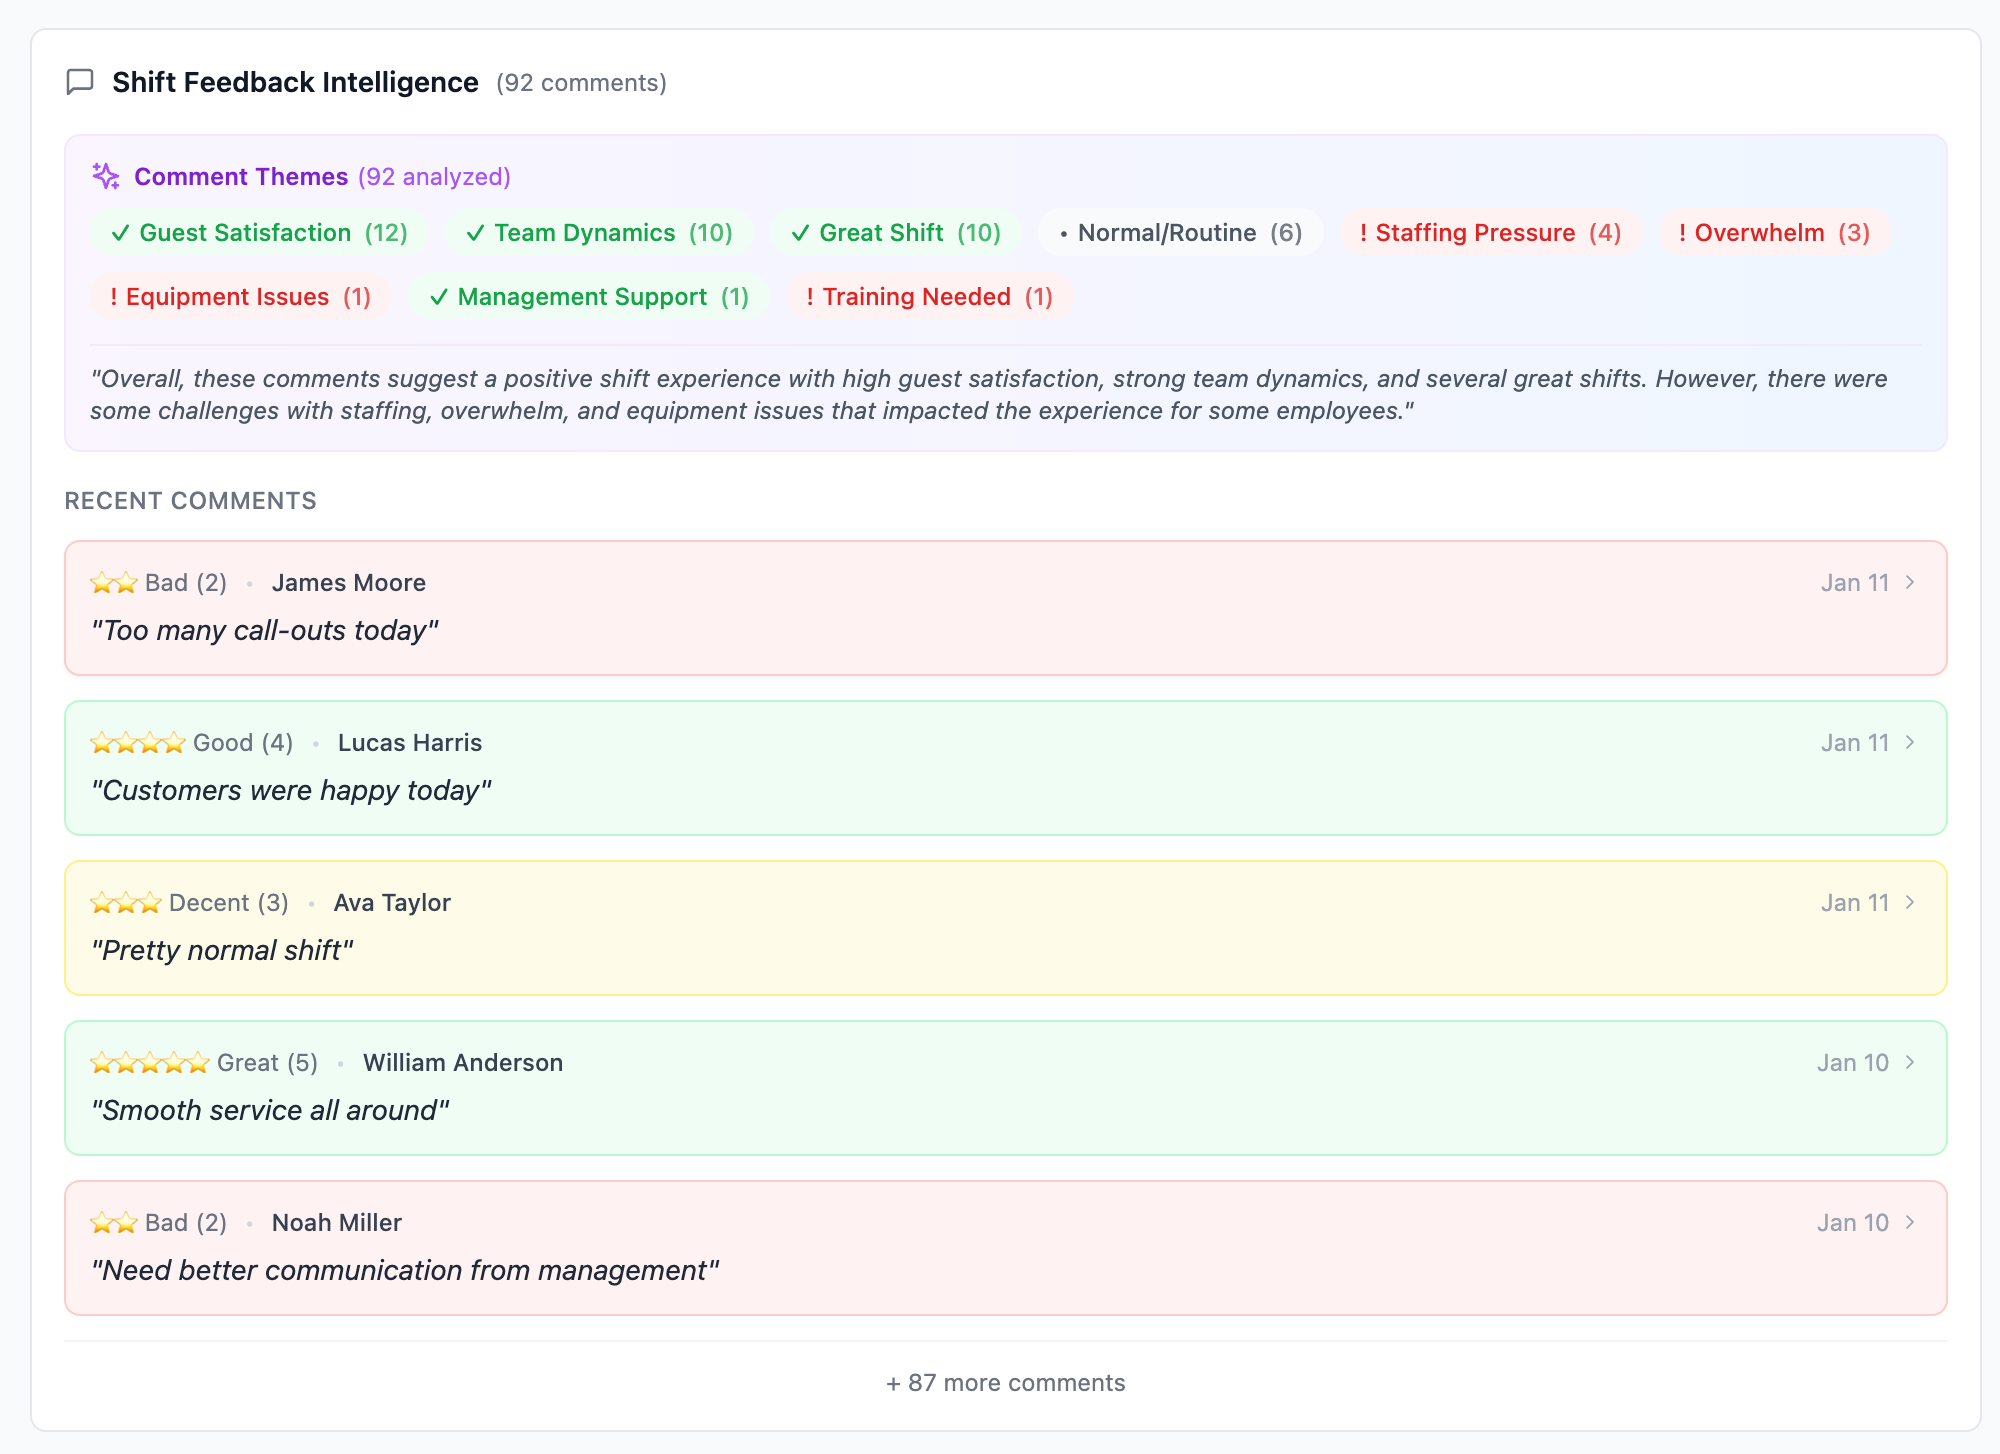
"Too many call-outs today." "Customers were happy today." "Need better communication from management." You're not reading hundreds of comments. You're seeing the patterns that matter.
Multi-Store Visibility
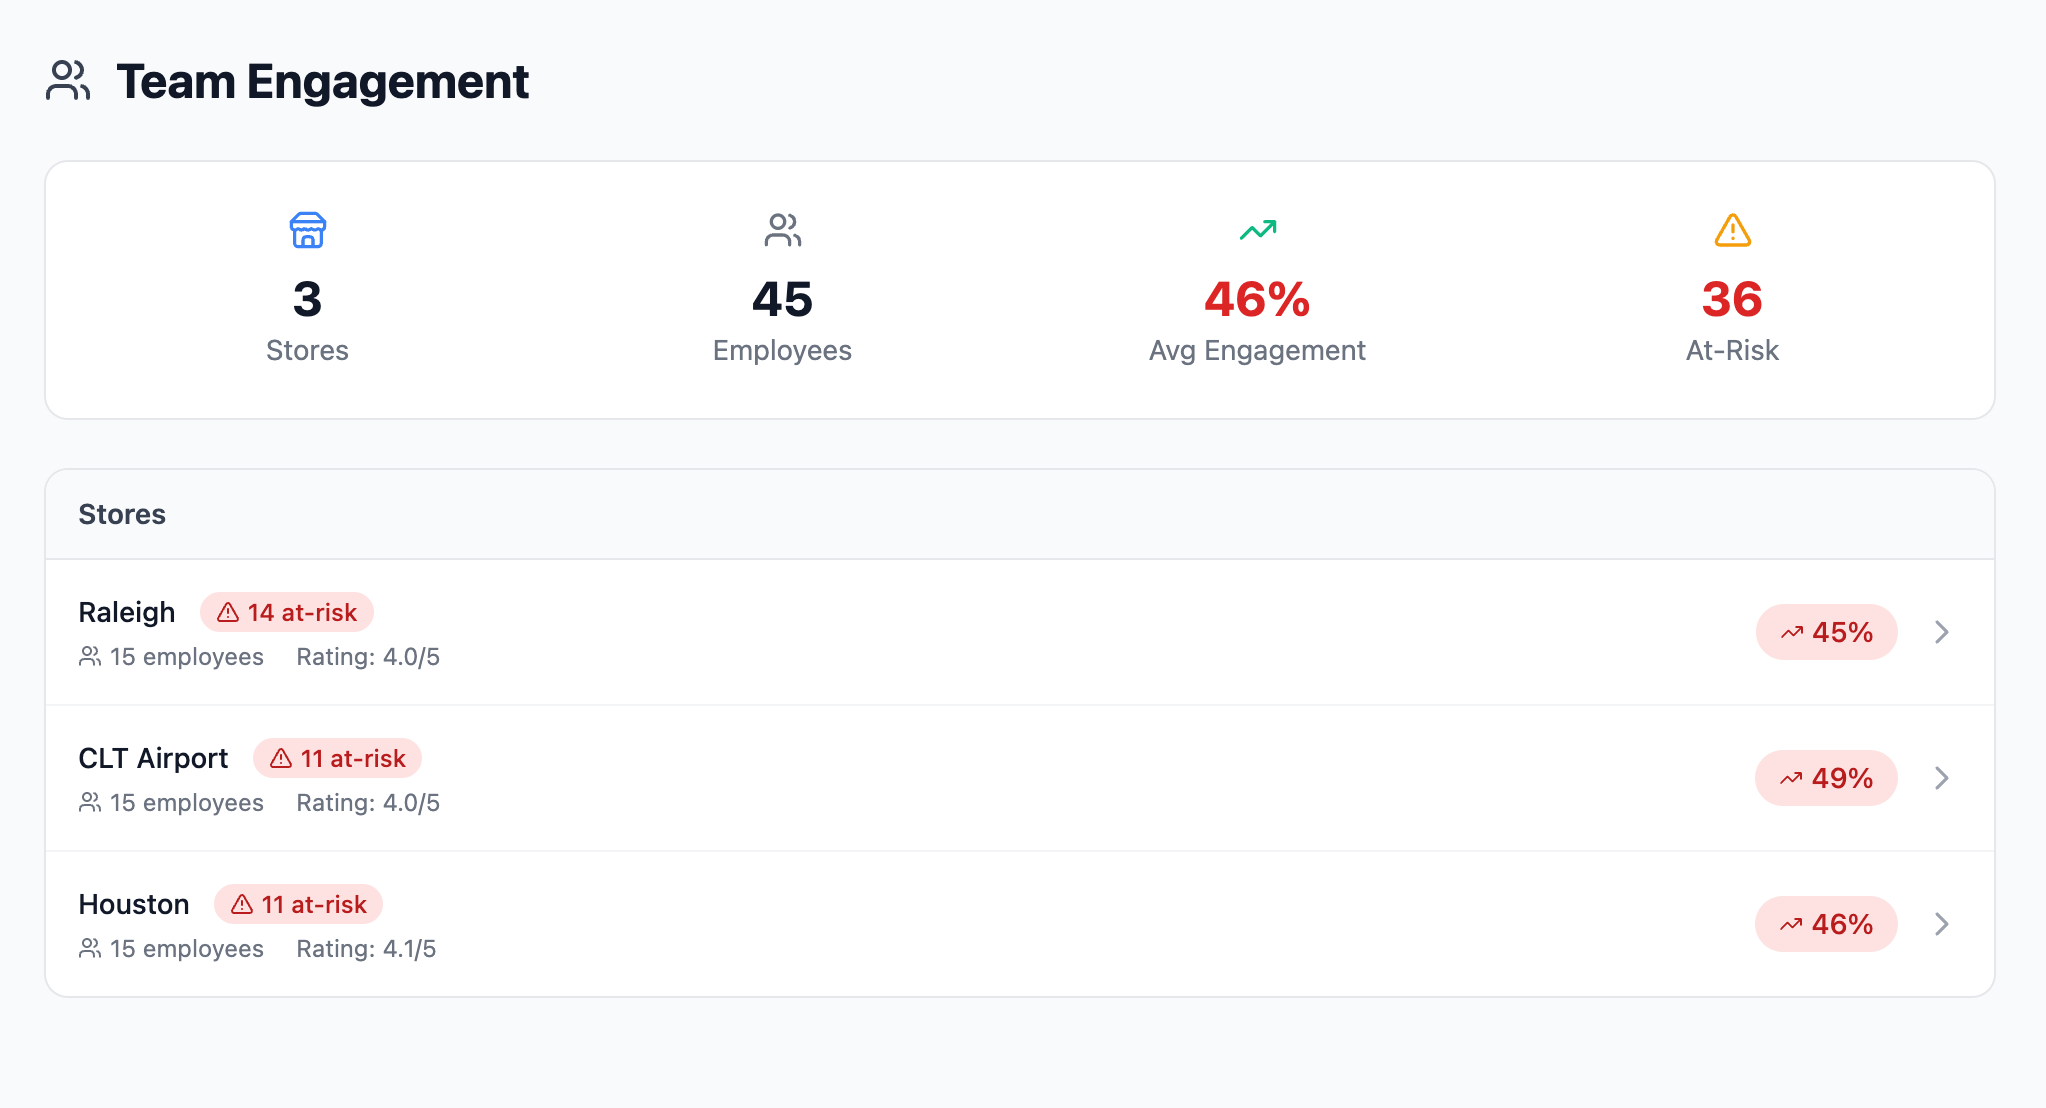
For operators managing multiple locations, the aggregate view changes everything.
See all your stores ranked by engagement score. Spot the location with 14 at-risk employees versus the one with 11. Understand which GMs are building strong teams and which might need support.
The Conversation Changes
Here's what really shifts when you have this visibility:
Before:
"I feel like you've been showing up late a lot."
After:
"I noticed you've been 10-15 minutes late on 6 of your last 10 shifts. What's going on?"
Before:
"People seem disengaged."
After:
"Our team engagement score dropped 8 points this month, driven primarily by increased shift drops and lower feedback ratings on weekend closes."
Before:
"We need to do something about retention."
After:
"We have 5 employees in the at-risk zone right now. Here's who they are and what specific signals triggered the alert."
Data doesn't replace human judgment; it sharpens it. You still need to have the conversations, make the calls, and build the relationships. But now you're doing it with clarity instead of guesswork.
Built for How Restaurants Actually Work
Everything syncs automatically with your scheduling software. No double entry. No extra logins for your staff. Clock-ins, clock-outs, shift feedback: it all flows in and becomes actionable intelligence.
Zero Setup for Your Team:
- Syncs shifts, locations, and employees automatically
- Punch data updates every few hours with no manual imports
- Daily reports delivered automatically at 7 AM in your timezone
- Mobile-friendly dashboards for checking between rushes
The Operations You've Always Wanted
Strong restaurant operations aren't built on heroics. They're built on systems: clear visibility, early warning signals, and the time to act before small problems become big ones.
Attendance tracking shows you what happened. Engagement scoring shows you what's coming.
Together, they give you something rare in this industry: the chance to get ahead of problems instead of constantly reacting to them.
Your team deserves a manager who sees them clearly. Your business deserves operations that run smoothly. And you deserve tools that make both possible.
Ready to See Your Team Clearly?
Get started with PeakOps in under 5 minutes. Attendance tracking and engagement insights with no extra setup required.
Schedule a Demo